|
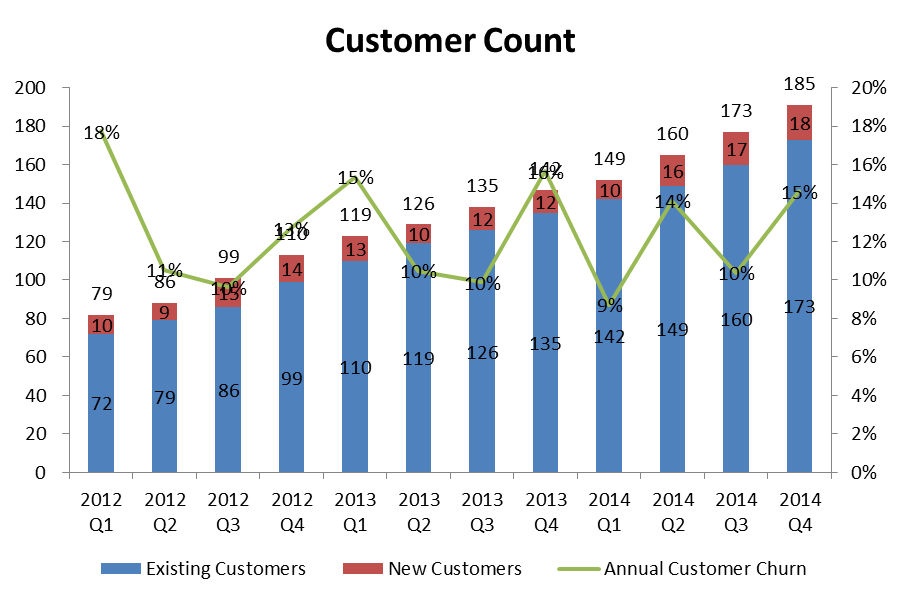
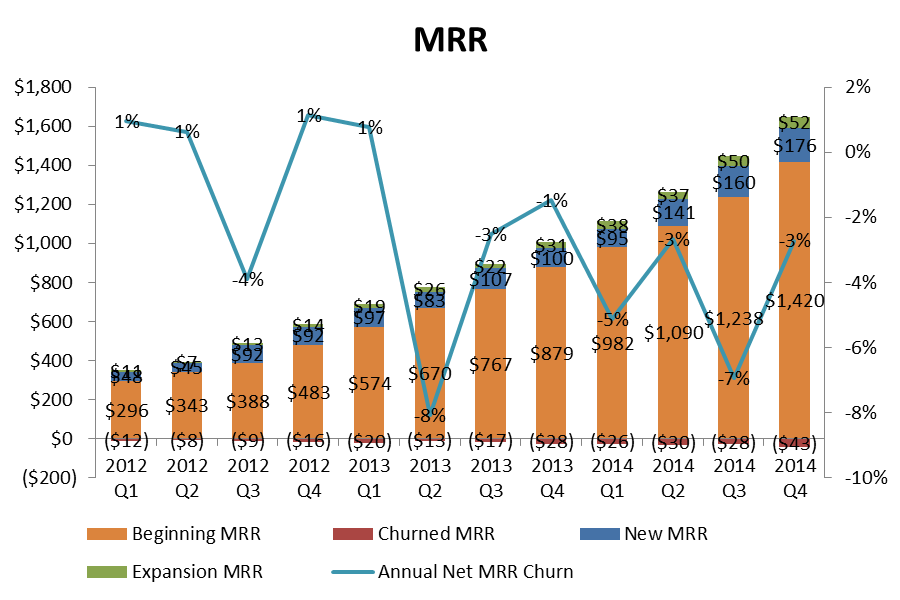
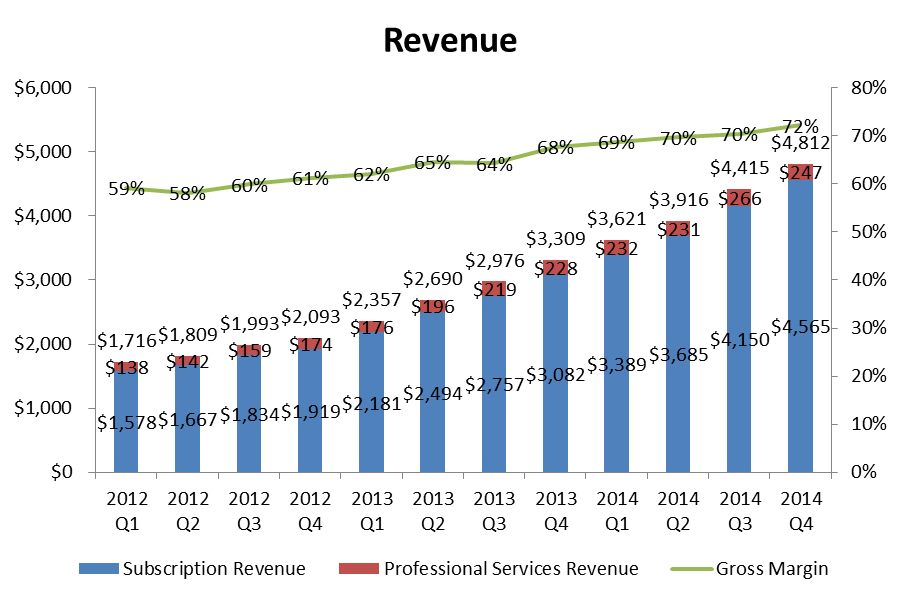
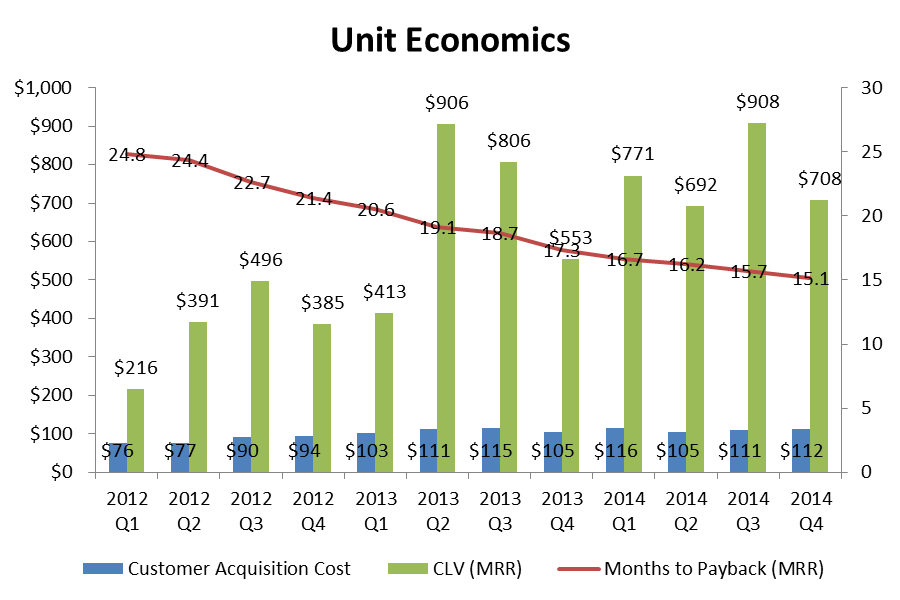
As the resident data guru at Emergence, I receive weekly requests for help from portfolio companies and startup CEOs. What metrics should I be tracking? What metrics should I display in my board decks? How should I benchmark myself versus other SaaS companies? Unfortunately, there is no one size fits all answer as each company should have unique KPIs they target and track. Establish Company Objectives and Measurable Targets My personal philosophy is to break company objectives into measurable targets and then show the plan versus results over time. Objectives and targets should always be broken down into their most relevant components. For example, let's say you want to have a sales goal. You should not have your sales goal be a total bookings target. In a SaaS business, renewals make up an increasing % of bookings over time and thus you can miss your new bookings target by 50% (a bad miss) but only miss your total bookings by 10% (if your renewals make up 80% of total bookings). In this particular case, You should establish and track separate targets for new bookings and renewal bookings. Further, you probably want to track ACV (annual contract value) bookings as opposed to total new bookings (as multi-year contracts could enable you to hit targets but would not translate into revenue that year). Cohorts! My second most important tip is to break data into relevant cohorts. The most common groupings for cohorts are customer type (industry, size, location), date of acquisition (monthly, quarterly) or method of acquisition (marketing, referral, organic, etc.). Segmenting customers into cohorts enables the higher level analysis which leads to strategic decision making. Using our example from above, you might consider having separate new ACV bookings targets for small/medium and enterprise customers. You may establish renewal bookings targets that differ by the age of your cohorts (in a given quarter, older cohorts should have higher retention than newer cohorts). Lastly, you should have different bookings targets by acquisition channel to incentivize the sales and marketing behavior which generates highest CLV (customer lifetime value). Revise and Repeat Once you've established your targets, it is important to track results and then revise your estimates as strategic objectives change. Continuing with our bookings target example, if you miss on new ACV bookings, then you should quickly determine why you missed (by looking at the cohort data) and revise targets. Let's say you missed new ACV bookings because the organic channel lagged expectations. You could decrease your organic target for the next quarter while simultaneously increasing marketing spend and the new ACV target from customers acquired through marketing. The Dashboard Now that I've explained why each SaaS company should have their own custom dashboard for their business, I present to you my generic SaaS dashboard (attached at the bottom). Oh, sweet irony! All kidding aside, I've created this dashboard over a couple of years and it includes best practices for how to calculate the high level metrics every CEO should track. You should definitely take these basic building blocks and customize the dashboard to meet your specific needs. Questions? Tweet at me or shoot me an email. 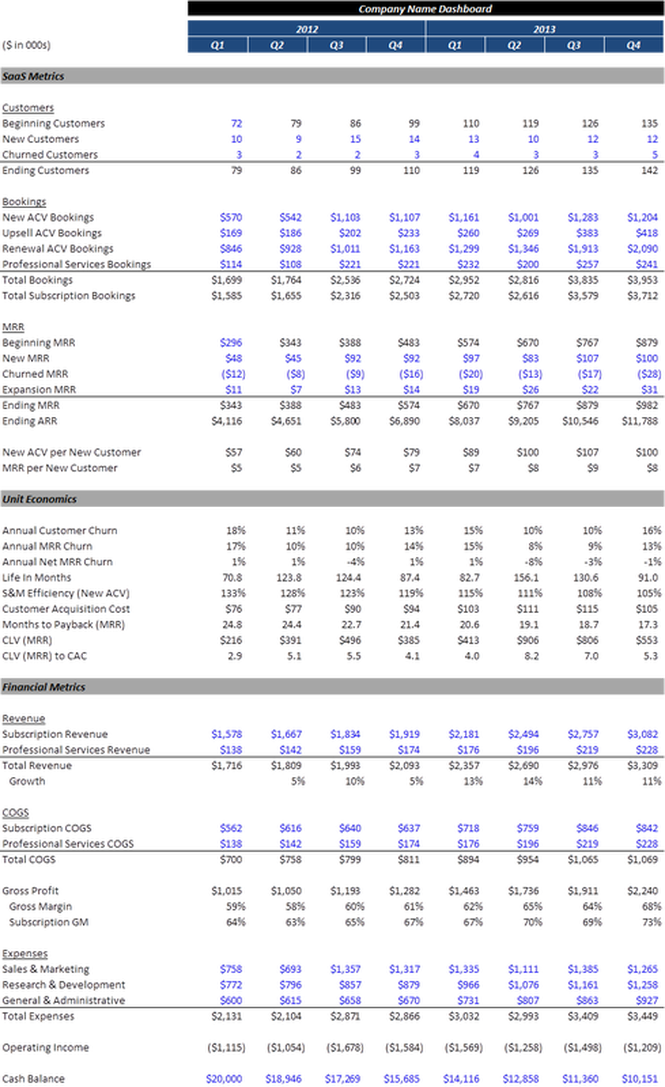
Away from the fickle eyes of consumers, deep in the basement of app stores, enterprise mobile apps are fighting each other for the attention of business users. Given the restrictions of their target audience, business app developers simply cannot utilize the same techniques that consumer app companies leverage. Why is that? And more importantly, how can mobile business apps efficiently speed up user acquisition?
Customer Acquisition Models For Consumer Apps First, let’s examine the methods consumer app developers have used to efficiently acquire large user bases and why business app developers cannot leverage the same techniques. Obviously, consumer apps have a large target audience as everyone with a smartphone is a potential customer for a consumer app. As a result, the size of the target audience is capable of generating enough web and app-store search volume to build an initial customer base for apps. Plus, the undifferentiated nature of consumers means that cross promotional advertising on consumer apps can be a very effective and efficient user acquisition technique. For example, an advertisement for a mobile game can appear on any mobile app and the end user is always a potential target. On the contrary, the target audiences for business apps are often much smaller and may be focused on a particular vertical niche such as doctors or real estate professionals. As a result of the smaller target audience, business apps do not see a sufficient level of web and app-store search volume. Further, cross promotional advertising is much less effective because of the niche target audiences. For example, less than 1% of US smart phone users are doctors, which makes it very difficult to target that vertical with display ads. Lastly, consumer app developers with deep pockets have been known to game app store rankings. At the launch of a new consumer app, the developer can pay for downloads through services, such as Chartboost and Tapjoy, until they crack the top 25 of an app store. At that point, their visibility on the app store leaderboard increases their discoverability to the point where organic downloads can take over. Given their smaller target market, mobile-first business apps simply cannot compete with consumer apps for space in app-store rankings (there are no business apps in the iOS Top 50 as of this writing). Building Virality Into Enterprise Apps Now that we’ve explored what is not working for enterprise mobile apps, let’s focus on what is working: designing your product work flows to drive direct exposure to new potential users and building in opportunities for indirect referrals through word-of-mouth virality. Dropbox is the quintessential paradigm of designing virality into a product. Users are incentivized to refer Dropbox because they receive free additional storage for doing so. Additionally, the act of sharing a file with a friend inherently exposes Dropbox to new potential users and serves as a trigger for customers to talk about the service. Building on the lessons learned from Dropbox, there are three techniques that emerging mobile-first business app developers are using to build virality into their products: triggers, incentives and work flow. Triggers are events that spur an action. In this particular context, triggers are actions that an app user takes which provide for an opportunity to discuss the application. Expensify, a mobile app for business users to submit expense reports, has built in two word-of-mouth referral triggers: 1) every time a user takes a picture of a receipt for expense reporting, they are triggered to talk about the app with the coworkers or clients present; 2) the act of submitting an expense report triggers an explanation of the product to the person approving the report. Incentives play on the concept that users are much more likely to actively refer a product if they receive some practical value for doing so. Plangrid, an iPad app for managing construction-site blueprints, uses incentives to spread among the different companies that collaborate on construction sites. Plangrid’s value to each site user increases with each additional company and user that joins and adds to the project. Thus, users have a practical incentive to refer the product to new target users. Lastly, building virality directly into the workflow of how a customer uses an app is a very effective way to expose the app to new potential users. Doximity, a mobile professional network for physicians, has built virality into its product workflow through its secure messaging capability. Doctors use Doximity to send HIPAA compliant messages to other doctors. Every message sent from a user to a doctor not yet on the platform exposes a new potential user to the product as the message recipient must install Doximity to read the message. Key For Enterprise Apps Mobile-first business apps have to follow different rules for customer acquisition in order to achieve the scale and marketing efficiency of their consumer-focused brethren. The key for enterprise apps is to focus on building virality into the product so users directly or indirectly spread the app within their target audience. The mobile-first business apps that emerge victorious will be the ones that leverage triggers, incentives and work flow to kick their user acquisition flywheel into overdrive. This piece originally appeared in TechCrunch. One of the keys to Yammer’s success was their focus on metrics, and tracking customer invites was one of the most important metrics. Yammer’s success relied on two types of customer invite virality: one, intracompany virality – when employees invite their colleagues to join the company network; and two, intercompany virality – when employees invite outside companies to sign up a new company network. Measuring the intracompany virality is pretty straight forward, but calculating the effectiveness of intercompany virality is quite a bit more complicated and will thus be the subject of this post. Why is it more complicated? Because you first have to measure how many intercompany invites spawn new networks and then you have to calculate how many new users join the new company networks. In the attached spreadsheet, you will find anonymized user and company data for a mobile social networking company. Using the domain names of corporate email addresses is an easy way to determine if an invite is intracompany or intercompany. In my analysis, for 1,000 users which were created via intercompany invite, roughly 30% of those users spawned new active company networks (they invited colleagues to join their new company network). 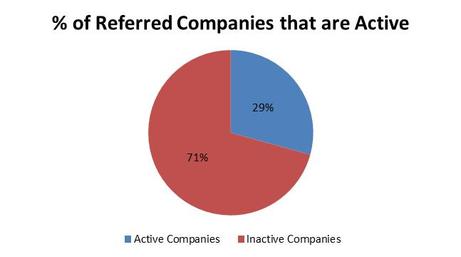 Taking the analysis to the second step, each active company went on to invite 10 additional users (on average). Roughly half of these new intracompany invited users became active and engaged users. 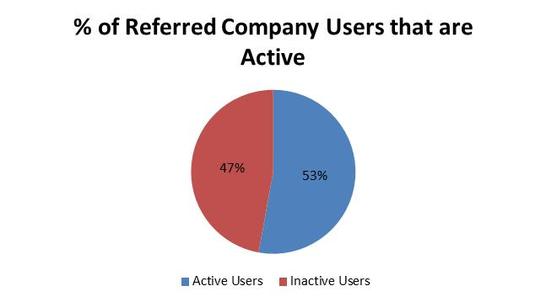 So what can we make of this analysis? In aggregate, of the 1,000 intercompany invites, 293 created new company networks which ultimately spawned 1,633 users. From here, you can calculate the marketing costs of the 1,000 intercompany referrals and accurately compare that cost to the customer lifetime value of the 1,633 active new users. If the CLV is higher than CAC, you can add more marketing fuel to the fire. So how do you accurately calculate CLV? Well…I’ll save that for another day. :)
SaaS comps can be segmented into a variety of different buckets - vertical versus horizontal, by industry, by size, by growth. I've opted to segment my universe of SaaS comps into SaaS Stars (fast growth, high multiples and significant market size), SaaS and Steady (medium growth, average multiples) and SaaSward Spiral (slow growth, low multiples, limited market size). 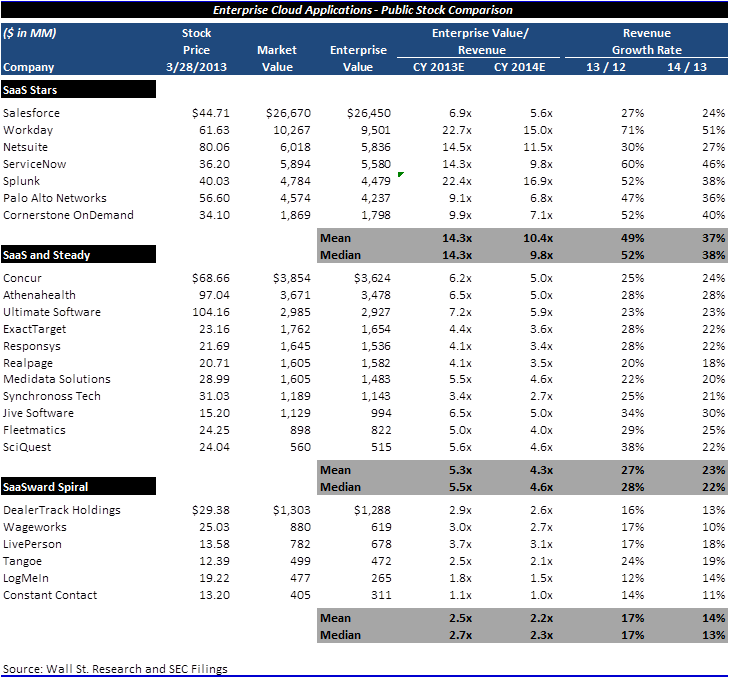 Customer churn is simply a consequence of doing business. Even the best SaaS companies, like Salesforce and Concur, will lose customers when companies go out of business. So how do you keep your customer base growing when you will eventually lose some of your older customers? Do you constantly have to sell new ones to make up for the ones you lose? Won’t this simply get harder and harder the larger your existing customer base gets? Well, yes and no. Acquiring new customers efficiently is critical, but you can also offset the loss of customers with upsells and growth from your existing customer base. In fact, the best companies actually experience negative churn – their existing customer base generate more upsell revenue than the revenue lost by churned customers. Veeva Systems is a great example of a company that has turbocharged its growth by following this model. The key to generating negative churn is to have a flexible pricing model that increases with usage (number of seats, number of servers, amount of storage space). Let’s see what this might look like:  As you can see in the chart, revenue growth per cohort increases over time. As a result, by the end, each cohort starts to tilt upward. In this example, the Company actually lost ~16% of its customers over the time period for this chart but more than made up for those customers with additional seats. The spreadsheet below shows you how to create this chart from the raw data. You can take this analysis one step further by building cohort retention curves, but I’ll save that for another day. :)
This piece originally appeared in VentureBeat.
Consumer-to-consumer (“C2C”) marketplace startups are enjoying a Renaissance, as exemplified by Airbnb and others. Sites like these that facilitate transactions between people have disrupted older offline business-to-business marketplaces by taking advantage of ubiquitous mobile access, and delivering a better experience. This recent C2C marketplace success is spurring a new crop of similar business-focused ventures, which I believe have tremendous potential to leverage the unique synergies of combining the marketplace model with the software as a service (“SaaS”) platform. By serving as the access portal to the marketplace, the system of record and most importantly, the paywall that drives predictable revenue, SaaS can revolutionize the marketplace model to offer modern advantages the failed B2B marketplaces of the early 2000s never had. These include revenue predictability, favorable unit economics and a barrier to disintermediation. Here are the three key advantages of SaaS: Larger market size and revenue predictability In the late 1990s, Zoho Corp. emerged as an online marketplace for hotel supplies that raised $63 million. Targeting the massive hotel industry ($120 billion in revenue in 2012 according to IBIS), Zoho operated on a transaction model whereby the company received a small percentage of each transaction. This transaction model severely limited revenue potential and made commissions unpredictable. Zoho ultimately shut down when key buyers, including investors such as Harrah’, purchased only a small fraction of products from the heavily commoditized hotel supply chain. As a result, Zoho earned small commissions on low margin business with little predictability. Today, business marketplaces can use SaaS platforms to increase market size and improve revenue predictability by selling subscriptions to access and manage the marketplace. For example, LiquidSpace enables individuals to reserve meeting rooms, conference or office space at commercial venues such as hotels. As a transaction marketplace alone, the market size is similar to Zoho’s which aimed to apply a small commission to a large target market and win by capturing volume. However, in addition to monetizing transactions, LiquidSpace also sells their platform directly to hotels (50,000+ potential), universities (100,000+ potential) and enterprises (potentially in the millions) as a service to manage their own meeting spaces internally. These internal networks greatly increase the market size opportunity as well as revenue predictability with a monthly subscription service instead of a transactional model. Further, adding subscription customers with internal networks of captive guests, students, and employees greatly increases the number of individuals with access to the public marketplace since it is all one platform. Better Unit Economics Every successful startup faces competition and, eventually, margin pressure. This is particularly true for transactional marketplaces. For example, oDesk, Elance and 99Designs are all sizable marketplaces that connect jobs with freelance workers. But, the success of these marketplaces drove up the cost of keywords used to acquire traffic and drove down the price of jobs (and therefore net margin to the marketplace provider). On the other hand, using a SaaS-based subscription model, business marketplaces can improve unit economics in three ways:
For example, Scripted connects businesses to freelance journalists through its online marketplace. Since Scripted sells access as a SaaS subscription, businesses sign annual contracts (which lowers churn) with Scripted supplying a minimum quantity of written content. If the customer does not utilize the full quantity of service, subscription breakage occurs – Scripted still earns the full revenue but does not incur the cost of providing the unused service (which expands margins). In combination, these two forces increase customer lifetime value, allowing Scripted to increase sales and marketing spend to scale growth more aggressively. A Barrier to Disintermediation The threat of disintermediation should be top of mind for any good middleman. Marketplaces serve as insurance to both supply and demand and provide the necessary security to complete transactions in an uncertain environment. However, once a network connects two parties, nothing prevents them from circumventing the platform and dealing directly. For example, MetalSite, one of a few vertical specific marketplaces in the early 2000s, connected commodities buyers and sellers via auctions. But, MetalSite and many other vertical B2B marketplaces failed because they were taken out of the loop after the first transaction as suppliers began bidding lower prices directly to buyers, without paying commissions to MetalSite. On the other hand, OpenTable, a restaurant reservation marketplace, has become the de facto system of record for many customers. As a result, customers are locked in to using the platform, which ensures OpenTable captures each transaction and receives its commission. Additionally, restaurants are much less likely to replace OpenTable with a competitor because it keeps the system of record as opposed to simply being a source of reservations. Final Thoughts The initial wave of business-focused marketplaces crashed in the dotcom bust because they focused on transactional pricing, competed with incumbents on price and failed to build relationships with their marketplace participants. We are in the early innings of a new wave of business-focused marketplaces that are likely to succeed, thanks to SaaS, which can serve as the system of record, and generate predictable revenue.  In the chart above, you can see that new installs as a % of the overall user base should decrease over time. The earnest hope for social and mobile app developers is that you drive initial installs through marketing, retain that user base over time and hope for viral word-of-mouth marketing to drive continued growth. After you’ve downloaded the spreadsheet below, take a few minutes to break down and understand the formula that calculates retained DAU. <Warning> It’s a pretty complicated formula. “Why would you make it so complicated?” Well, you could build out a waterfall table like you would for monthly retention, but that would get out-of-control in a hurry. And, let’s face it…I love making crazy formulas in excel. </Warning> In most cases, companies drive installs through SEM or other forms of pay for performance marketing. The other key assumption to play with in this model is the retention curve. You will ultimately want to forecast user retention based on historical data. How do you do that? Well…I’ll save that for another day. :) Forecasting user retention is hard enough for monthly subscriptions, but the problem becomes exponentially more difficult when you want to forecast daily retention. And quite frankly, social apps (like Zynga’s Farmville) and mobile games like Plants vs. Zombies really care about daily active users as that is what drives their revenue.
Congratulations, you’ve just acquired a customer. Now what? In traditional enterprise software, you would be done and move on to find the next customer. However, with today’s SaaS and freemium models, you need to focus more than ever on user experience and driving engagement. Why is engagement so important? Well, in monthly self-service subscriptions, customers can churn out just as quickly as they sign up, and in freemium models, customers can remain free forever if they aren’t engaged (and sometimes even if they are). 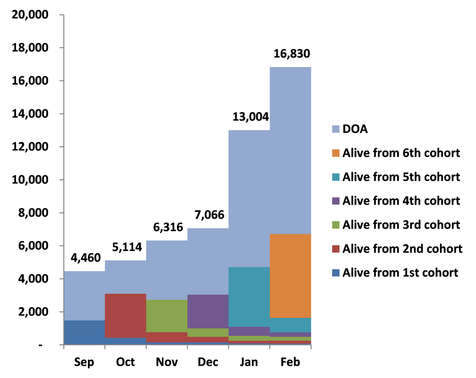 Let’s examine the graph above. If you only looked at user counts, you’d see a nice up and to the right trajectory. Unfortunately, when you break the users down into monthly cohorts, you can see how difficult it is to build an engaged user base when customers are quickly losing engagement. It’s hard to tell by user counts, because in this case, the free users aren’t quitting, they are just inactive. Before you can begin testing and optimizing your product for engagement, you will need to build a dashboard to measure engagement. 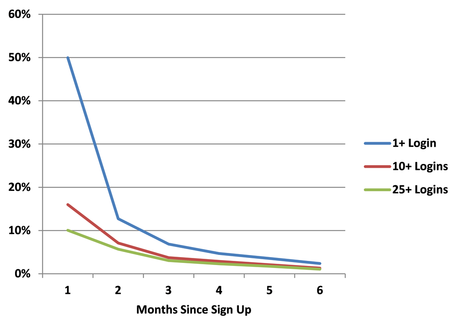 With this sort of a dashboard, you can track cohort engagement over time and tie improvements to engagement to changes in product. The spreadsheet below contains both of these dashboards plus the formulas to build them from the raw user data. After you’ve put in your data, you should begin testing ways to keep your customers engaged and bring back inactive users. In the beginning, you may not have enough data points to create meaningful curves. You can actually extrapolate curves from as little as 3 months worth of data. How you ask? Well…I’ll save that for another day. :)
The Holy Grail of viral marketing is achieving a K-Factor > 1. This implies that every new user brings more than one additional user. Of course, achieving a K-Factor > 1 is not easy. Dropbox was able to do it through product invitations and early Facebook games accomplished the feat through merciless spamming. The end result of a high K-Factor is that your user count explodes, your marginal customer acquisition cost falls to zero and VCs start stalking you. 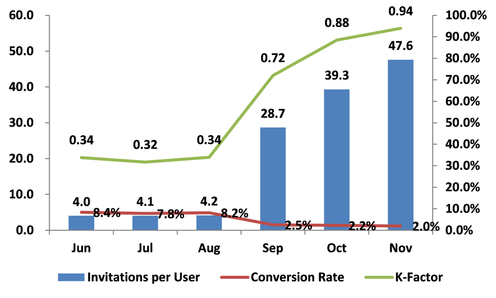 Invites are up and K-Factor is exploding toward 1. Good news, right? Well, conversion rates have decreased so maybe we aren’t seeing the complete picture. After all, not all K-Factors are created equal and you as the entrepreneur need to understand how to decompose K-Factor into its components and how to optimize each component to best meet your goal. The spreadsheet at the end of the article shows how you can easily process raw user data into invitation funnels. These invitation funnels and their corresponding K-Factors are displayed below: 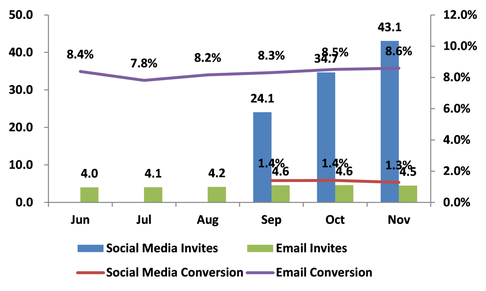
Mark Suster wrote a great post covering why convertible notes can be a hidden tax on entrepreneurs. This topic has also been fairly well covered by a number of high profile Silicon Valley law firms so I’ve just constructed a spreadsheet to demonstrate the actual mechanics and allow you to play with the inputs.  In the example above, you can see that $500K of convertible notes winds up with ~$1.3MM in preferences and ~7.3% ownership because of the $4MM cap. That’s 1/3 of the ownership that the VC gets in a priced round for ~8x the money! After you’ve downloaded the spreadsheet below, you can enter in your expected scenario in the cells with blue font. Once you have your expected scenario, you may want to graph the ownership changes and a liquidation waterfall... but I’ll save that for another day. :)
People often ask me, "How can I get a job in venture capital?" There are a plethora of different paths to landing a gig in VC, but there are really only four well-traveled roads:
I was incredibly lucky to have navigated path #4 and doubly blessed that I landed with the amazing team at Emergence Capital. Here is the four step method I used to improve my chances:
I developed 4 different Investment Idea Presentations and I tailored the companies in each presentation for the person I pitched. I probably had a 50/50 ratio of getting a meeting and I ultimately talked to at least 30 different investors. Out of those 30+ individuals, I came across only 4 firms interested in hiring an investment professional and I was fortunate enough to land with my top pick. Han Solo said, "Never tell me the odds." Well, I just told you the odds and hopefully gave you the edge to overcome them. Good luck! |
|||||||||||||||