|
Last Friday, LinkedIn, Salesforce and Workday lost $18B in market capitalization. To put that in perspective, these three SaaS companies lost more in market cap on Friday than 15 current SaaS leaders are worth…combined. 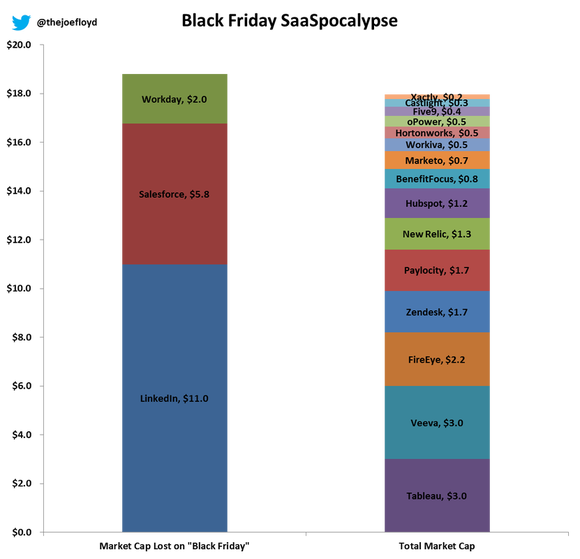 How can this be possible? LinkedIn, Salesforce and Workday are growing revenue with sticky customers and they are targeting large addressable markets. Are they now suddenly undesirable companies? Investors Paid Yesterday for Today’s Growth On the contrary, public SaaS companies have largely met growth expectations and performed according to Wall St. expectations. The problem is that investors already paid for the projected revenue growth in many SaaS stocks a full 2 years earlier. Let’s look at historical multiples of Enterprise Value / Forward Revenue for the past decade. As you can see below, enterprise software multiples have largely held steady at 3-4x forward revenue. However, SaaS multiples began diverging in 2012 from their historical range of 5-6x forward revenue. This divergence peaked at the end of 2013 and has remained elevated above historical averages for 2 more years. The Black Friday correction brought SaaS multiples back in-line with enterprise software valuations. Like many corrections, the market has overshot to the downside as we at Emergence believe long term SaaS valuations of 5-6x forward revenue will return. 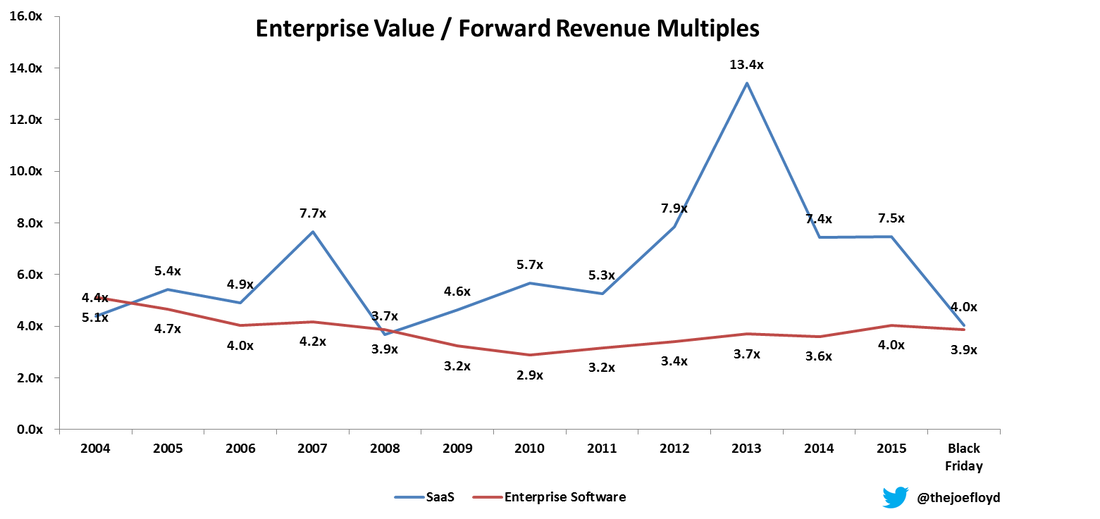 Note: Enterprise Software = Microsoft, Oracle and SAP. SaaS = Athenahealth, Castlight, Concur, Cornerstone, Dealertrak, FireEye, Marketo, Netsuite, Realpage, Salesforce, ServiceNow, Splunk, Tableau, Veeva and Workday. Growth Cannot Outrun Multiple Compression Recurring revenue business models are highly valued for recurring revenue and predictable growth engines. But what happens when predictable growth is no longer valued at predictable multiples? In the chart below, you can see what has happened to 4 of the hottest IPOs of the last few years. Workday has grown revenue from $470MM to over $1.1B in 2 years and yet their market value is down 40%. Marketo has doubled revenue over the last 2 years and their market value is down 60%. This is a really painful lesson for shareholders - it does not matter how fast revenue is growing if multiples are compressing faster. 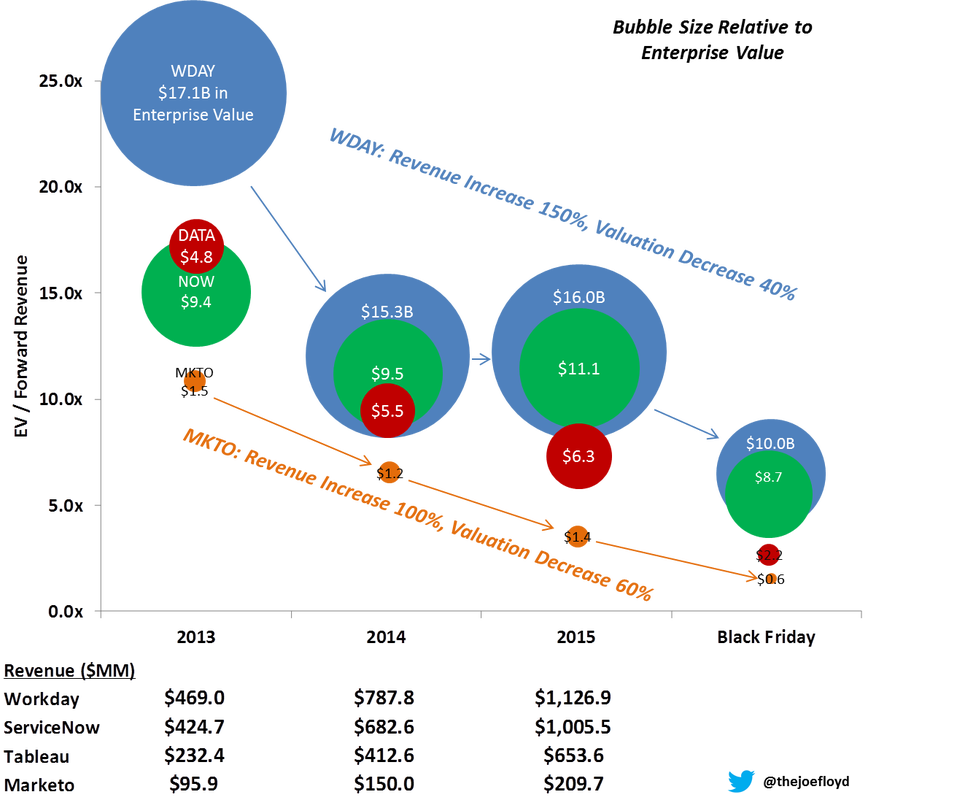 There are number of factors that drive valuation multiples: future growth rates, operating margin and addressable market to name a few. For most of the public SaaS companies, the two main drivers of multiple compression have been decreasing revenue growth rates and diminishing risk appetite of investors. Lessons for SaaS Entrepreneurs So what does all of this mean for SaaS entrepreneurs? To be blunt, the issue of multiple compression is an even bigger challenge for valuations of private companies. Unlike the public markets which have regular earnings that ignite valuation changes, the private markets have very few catalysts for change. Private valuations have been driven upward by an abundance of capital pushing valuations higher and higher. You can see evidence of this trend in the scatterplot below of private SaaS valuations from the last decade. 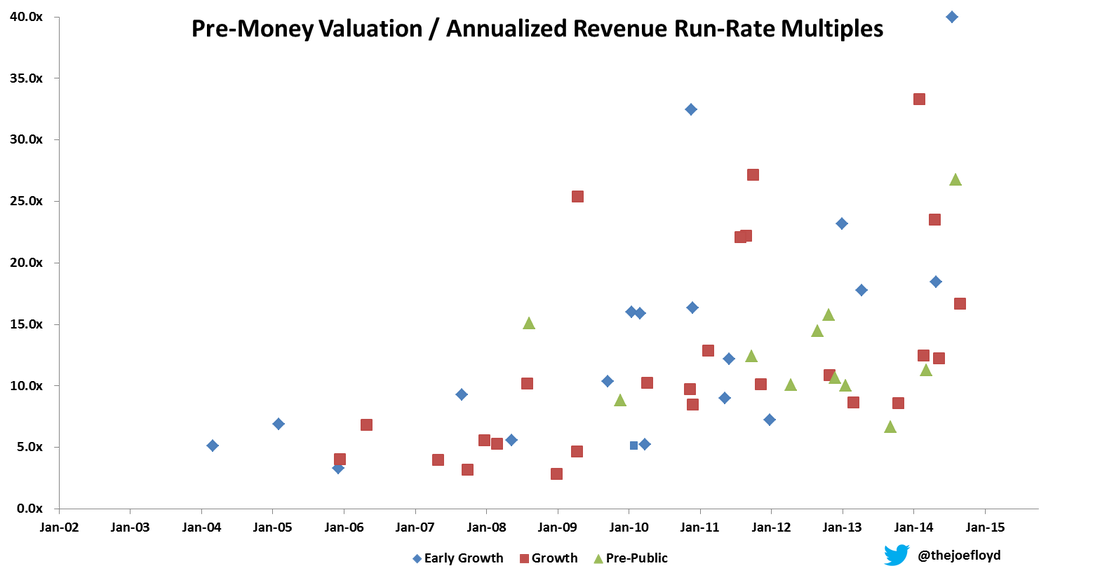 Note: Early Growth = $2-5MM ARR. Growth = $5-20MM ARR. Pre-Public is $20MM+ ARR. I excluded certain outliers.
Similar to the public markets, SaaS valuation ranges began expanding in 2012. Unlike the public markets, private market valuations remained elevated through 2014. I purposefully truncated the data at the beginning of 2015 so as not to give away too much proprietary information. However, I will say that 2015 continued the trend until Q4 when fundraising became noticeably tighter – particularly in angel rounds and late stage rounds. The direct impact of a contraction in multiples is only felt when entrepreneurs are fundraising and the end result for the market is more flat/down rounds and more situations where a startup has to drastically cut burn. Here is a scenario that I’ve seen play out multiple times in the last 3 months. Hot SaaS startup raised a large Series A 12 months ago: $8-10MM at a $40MM post-money valuation. The company projected 2-300% growth on a base of $1MM ARR. Because they raised a large A, they accelerated hiring to hit aggressive growth targets and they are now burning $600K/month. Now, that same SaaS startup is at $4MM ARR and they want to raise $20MM and they expect a valuation of $100MM. Only now, multiples have compressed to 10x ARR. The entrepreneur does not like the dilution of $20MM in a flat round so there is a hard decision to make: raise less and drastically cut burn or raise what you need and suffer dilution. This situation can become a vicious cycle as sustaining growth is critical for future fundraising. This scenario oversimplifies the fundraising process and certainly every situation is different. However, the point I want to make is simple. The best entrepreneurs and best companies will be just fine fundraising even with a tightening market. It’s the startups with challenging cap tables, cost structures or market timing issues that will really struggle to fundraise. Black Friday isn’t the canary in the coal mine – it should be the last wake up call for SaaS entrepreneurs to take a good look at their business and make absolutely certain that they have a contingency plan for 18 months of cash. P.S. If you want to preserve cash without cutting costs, here are 5 cash flow hacks for SaaS startups. This post originally appeared in TechCrunch.  Update since last quarter:
  Update since last quarter:
  Update since last quarter:
  Update since last quarter:
  Updates since Q3:
 Update since Q2:
 Update since Q1:
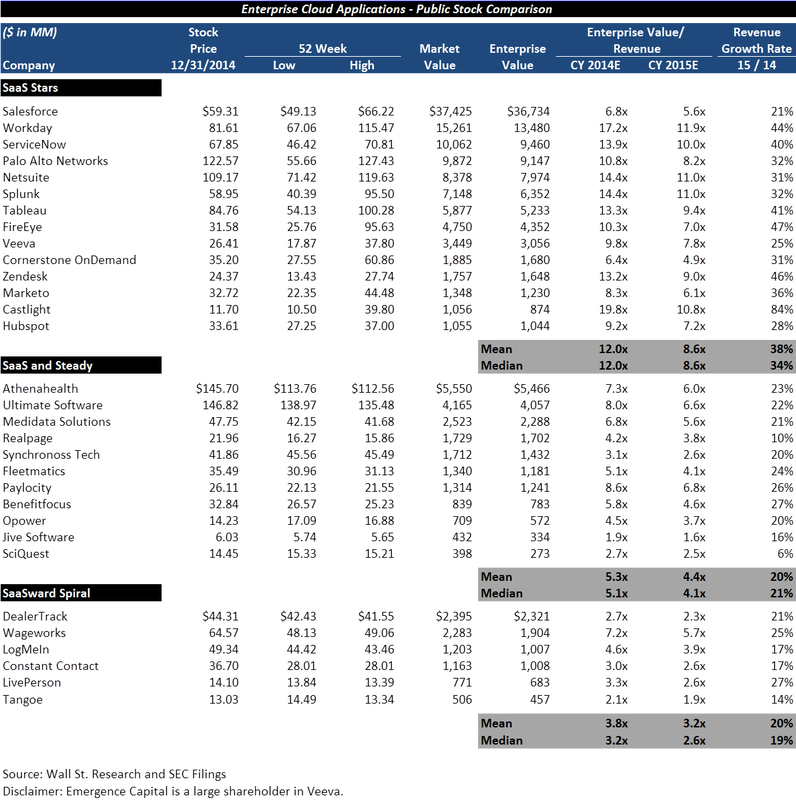
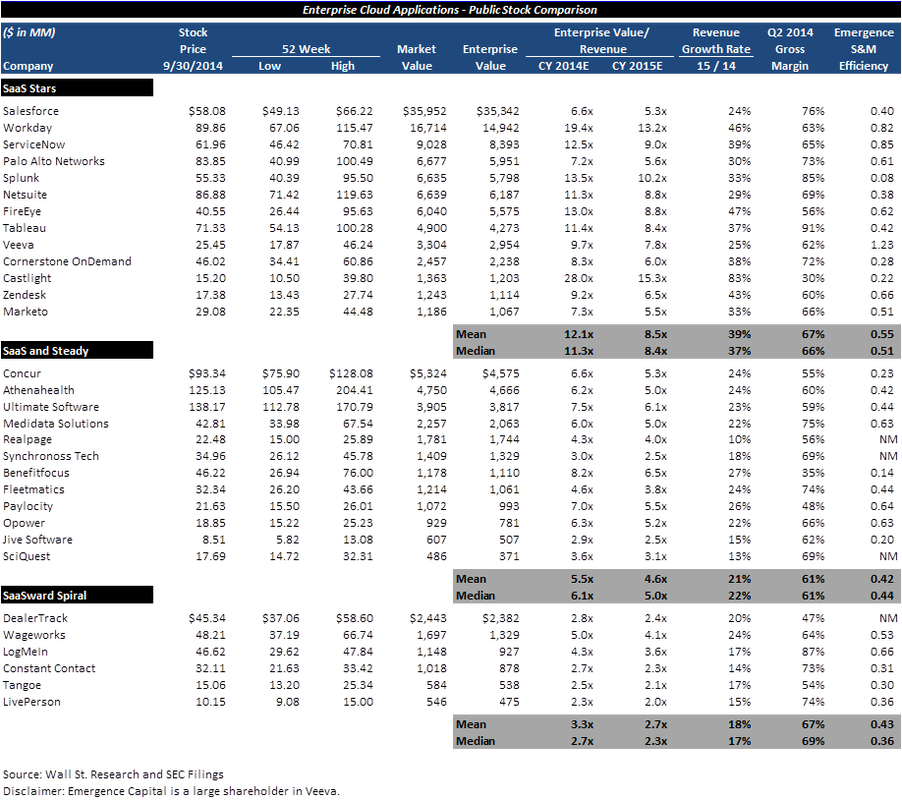
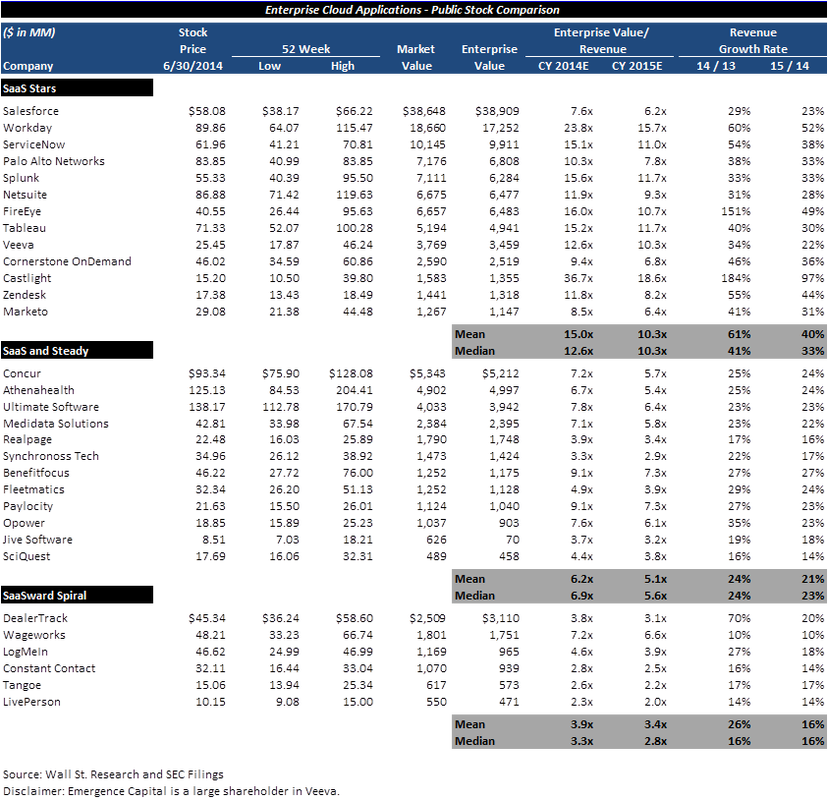
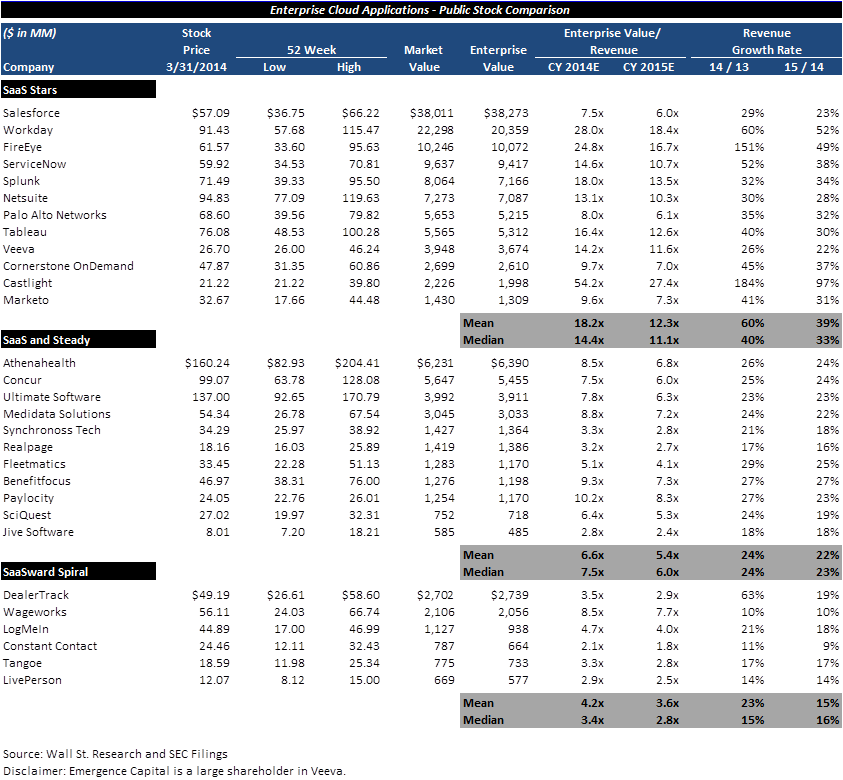
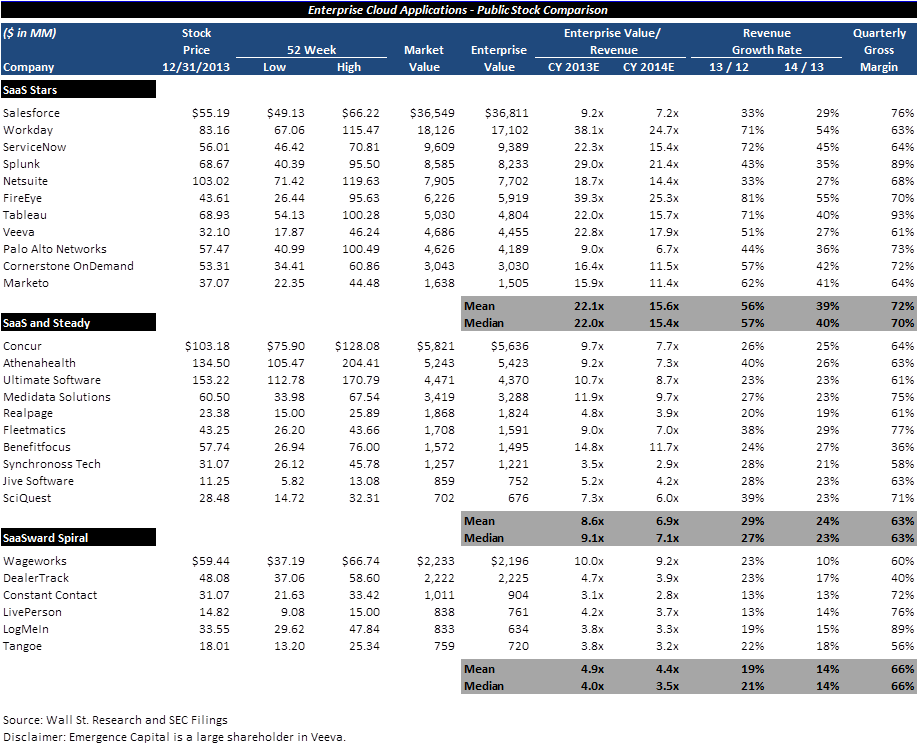
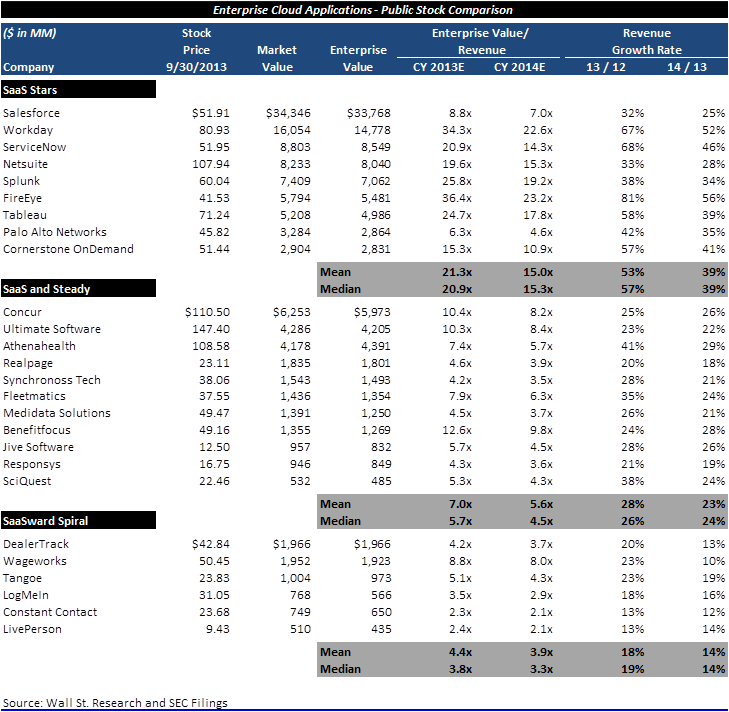
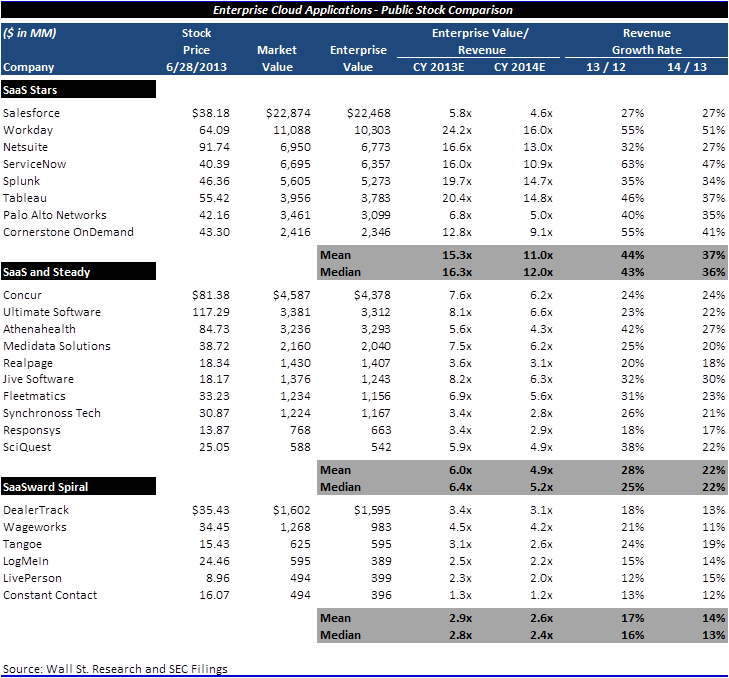 SaaS comps can be segmented into a variety of different buckets - vertical versus horizontal, by industry, by size, by growth. I've opted to segment my universe of SaaS comps into SaaS Stars (fast growth, high multiples and significant market size), SaaS and Steady (medium growth, average multiples) and SaaSward Spiral (slow growth, low multiples, limited market size). 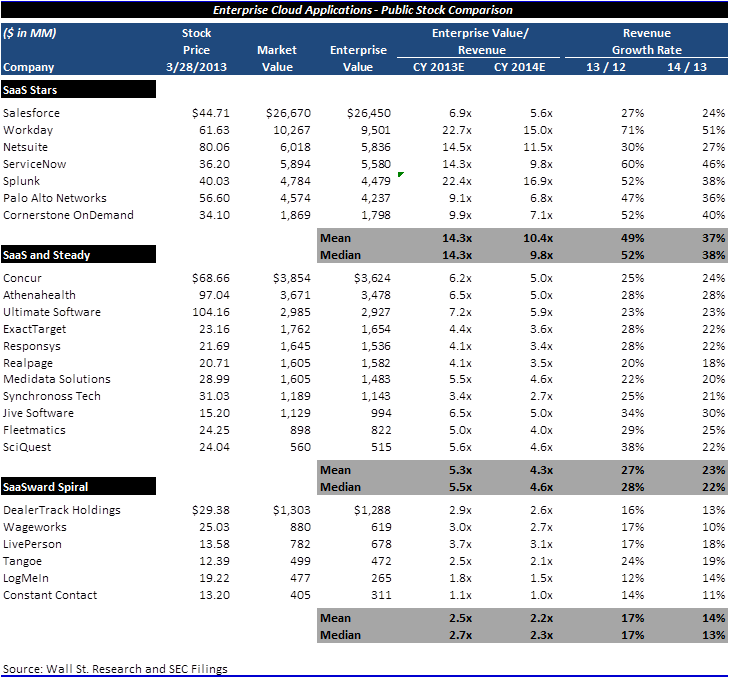 |
