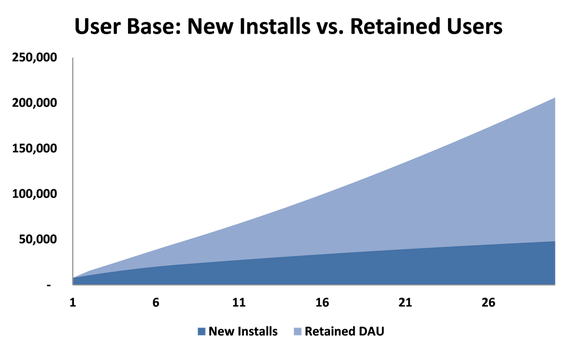
 In the chart above, you can see that new installs as a % of the overall user base should decrease over time. The earnest hope for social and mobile app developers is that you drive initial installs through marketing, retain that user base over time and hope for viral word-of-mouth marketing to drive continued growth. After you’ve downloaded the spreadsheet below, take a few minutes to break down and understand the formula that calculates retained DAU. <Warning> It’s a pretty complicated formula. “Why would you make it so complicated?” Well, you could build out a waterfall table like you would for monthly retention, but that would get out-of-control in a hurry. And, let’s face it…I love making crazy formulas in excel. </Warning> In most cases, companies drive installs through SEM or other forms of pay for performance marketing. The other key assumption to play with in this model is the retention curve. You will ultimately want to forecast user retention based on historical data. How do you do that? Well…I’ll save that for another day. :) Forecasting user retention is hard enough for monthly subscriptions, but the problem becomes exponentially more difficult when you want to forecast daily retention. And quite frankly, social apps (like Zynga’s Farmville) and mobile games like Plants vs. Zombies really care about daily active users as that is what drives their revenue.
Comments are closed.
|
|||
