|
The Holy Grail of viral marketing is achieving a K-Factor > 1. This implies that every new user brings more than one additional user. Of course, achieving a K-Factor > 1 is not easy. Dropbox was able to do it through product invitations and early Facebook games accomplished the feat through merciless spamming. The end result of a high K-Factor is that your user count explodes, your marginal customer acquisition cost falls to zero and VCs start stalking you. 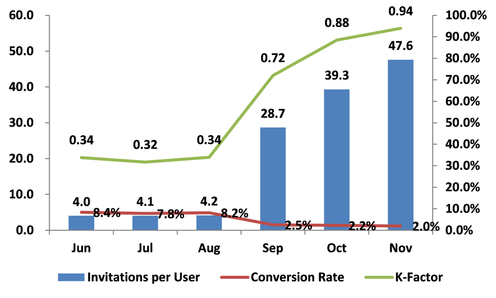 Invites are up and K-Factor is exploding toward 1. Good news, right? Well, conversion rates have decreased so maybe we aren’t seeing the complete picture. After all, not all K-Factors are created equal and you as the entrepreneur need to understand how to decompose K-Factor into its components and how to optimize each component to best meet your goal. The spreadsheet at the end of the article shows how you can easily process raw user data into invitation funnels. These invitation funnels and their corresponding K-Factors are displayed below: 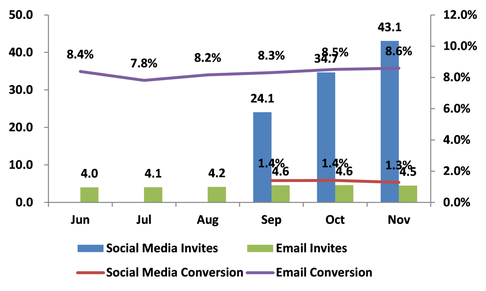
Comments are closed.
|
|||
